Google has made it clear in 2010 itself, that page load time and website speed are important factors to rank high in SERPs. CSS Sprites, Caching, Image optimization, Web hosting play a major role in website load speed optimization.
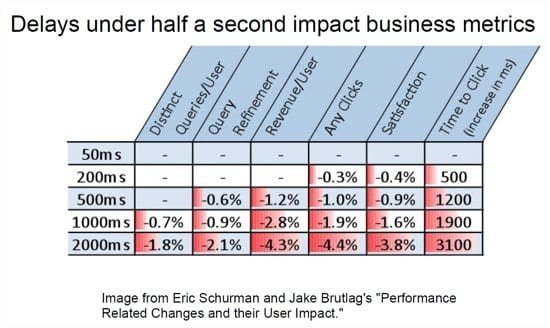
In June 2009, Amit Singhal and Matt Cutts, head of Google’s web spam team spoke about the results of an experiment conducted by Google. In this analysis, Google purposefully delayed the search results by half-a-second.
This had a significant impact on the number of searches per user. It showed that there was a decrease in number of searches from 0.2% to 0.6% for the above delay. Also the revenue/user decreased from 1.2% to 4.3% for a change of 1.5s. The number of clicks also drastically decreased from 1.0% to 4.4%.
My Case-Study
In 2016 also, it is of utmost importance to improve the web page load time. If your article or post is not loading within 2 to 3 seconds, after a user does a Google search, it is most likely that he will go back to the original query results. This also applies to mobile functionality. If such is the case, then the bounce rate (a metric measured to show how much time a user spends on your page) will also be high.
In my study, I chose one of my sites (seotipsit.com) which is hosted on InmotionHosting.com at the time of writing and registered with Name.com to check the performance boost of using different methods of improving page load time.
I was using VPS-1000HA-S package of InmotionHosting which is good for high traffic and consistent uptime. It provides 4GB RAM, 60GB storage, 2TB bandwidth and 2 IP addresses. It has free SSD drives, advanced server optimization and you have the liberty of choosing your data center.
I was also using the following list of WordPress plugins –
- Akismet
- Contextual Related Posts
- Elegant Themes Updater
- EWWW Image Optimizer
- Limit Login Attempts
- Media Tools
- Monarch Plugin
- Quick Adsense
- ThirstyAffiliates
- Wordfence Security
- WordPress Importer
- Yoast SEO
My Results
In order to see the performance gains of using each resource, I tested my website with two popular speed test tools. They are –
- Pingdom
- Gtmetrix
I divided my experiment into 3 steps.
In the first step, I just used the Inmotion Hosting (IH) VPS server to find out the loading times of my test page. I selectively chose this test page, as it has a moderate size, requests and images.
Note: Both the tools mentioned above, will give erroneous results if you test the page loading speed only once. You have to test it 3 to 4 times, to get an average value. In the first trial, the above tools will try to cache that page. In subsequent trials, the page load timing will significantly improve, on an average.
I also chose different server locations provided by tools.pingdom.com to see if there is any drastic variation of page speed based on server location. Normally, Google will show high ranking for your website pages for that particular country domain, if the server is located in that country.
For example, if your server is located in UK and you have .uk or .co.uk domain and your International targeting is set to “United Kingdom”, then there are more chances for you to rank well in Google.co.uk search engine results. Though this may not be true always, but it better helps in SEO.
In the second step, I chose to use the W3 Total Cache (W3TC) plugin to see how it improves page and website loading speed of my test site. The settings used for this plugin are stored in a file and given below.
In the third step, I decided to use the Clouflare CDN service to see whether there is an additional benefit to the caching mechanism. I used the free service which accelerates and secures your website by acting as a proxy between your visitors and Inmotion Hosting servers. This service says that, you can save bandwidth and reduce average page load times.
The below is the test page I used for testing with different speed testing tools.
https://www.seotipsit.com/what-is-seo-2015-definition-factors/
First Phase – Inmotion Hosting – VPS 1000S only
I heard good reviews about this hosting service. Also, some of my websites traffic jumped up during July 2015, so I thought it is in best interest to purchase VPS hosting. There are several advantages of VPS hosting, if your traffic is greater than 100k visitors per month.
Note: When you do a page speed test with a testing tool, the first result is not always the accurate one. During the first result, the tool will try to cache the page. So always check your page loading times, by doing atleast 3 to 4 times, by which you can get an average load time values.
My server is located in United States.
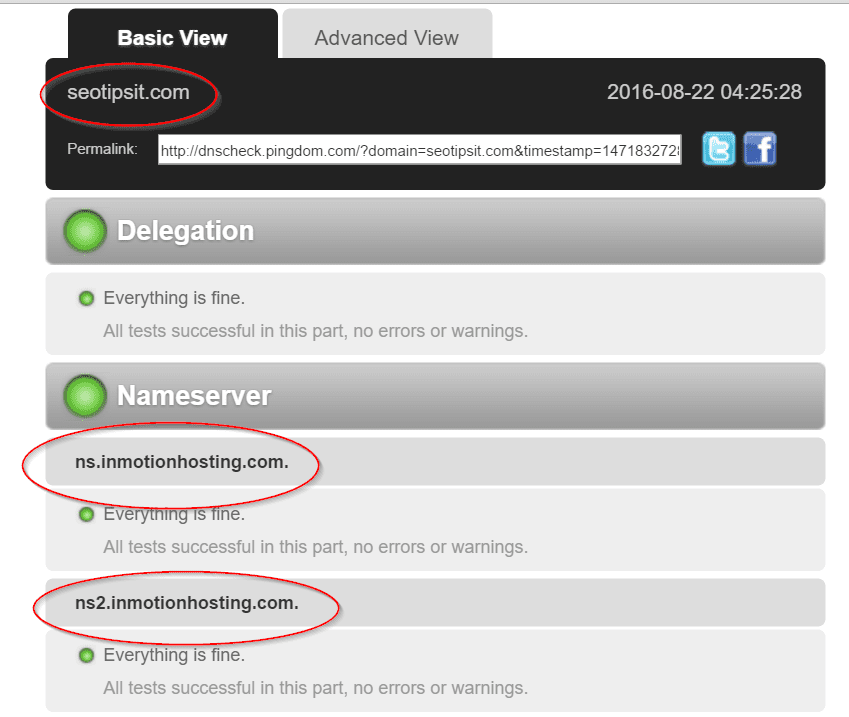
I intentionally took this server location, so that I can get good rankings for Google USA i.e google.com. If my server is located in India or Singapore, then there are lot less chances to rank well in google.com. Though this may not happen always, but it is always in best interest to place your websites on a server located in a country where you want to rank well for that Google tld.
Initially I tested the above test page, with tools.pingdom.com.
I tested the same web page from different server locations and atleast 3 to 4 times.
|
New York City, New York, USA |
|||
|
Page Size |
Load Time |
Requests |
Faster than of tested websites |
|
2.4MB |
4.08s |
88 |
41% |
|
2.6MB |
4.19s |
88 |
40% |
|
2.6MB |
4.50s |
88 |
37% |
|
Dallas, Texas, USA |
|||
|
Page Size |
Load Time |
Requests |
Faster than of tested websites |
|
2.4 MB |
2.90s |
94 |
56% |
|
2.2MB |
2.99s |
64 |
54% |
|
2.4MB |
3.14s |
79 |
52% |
|
2.2MB |
2.85s |
64 |
57% |
|
Melbourne, Australia |
|||
|
Page Size |
Load Time |
Requests |
Faster than of tested websites |
|
2.5MB |
7.73s |
86 |
19% |
|
2.5MB |
8.46s |
86 |
17% |
|
2.5mb |
8.55s |
86 |
17% |
|
2.5mb |
8.37s |
86 |
17% |
As you can see from above, since my server is located in USA, the page loading time is drastically less compared to Australia. Also, probably my server is located more closely to Texas, USA. That is the reason, we have much less web page load times. Generally, a page load time of less than 3 seconds is good for SEO.
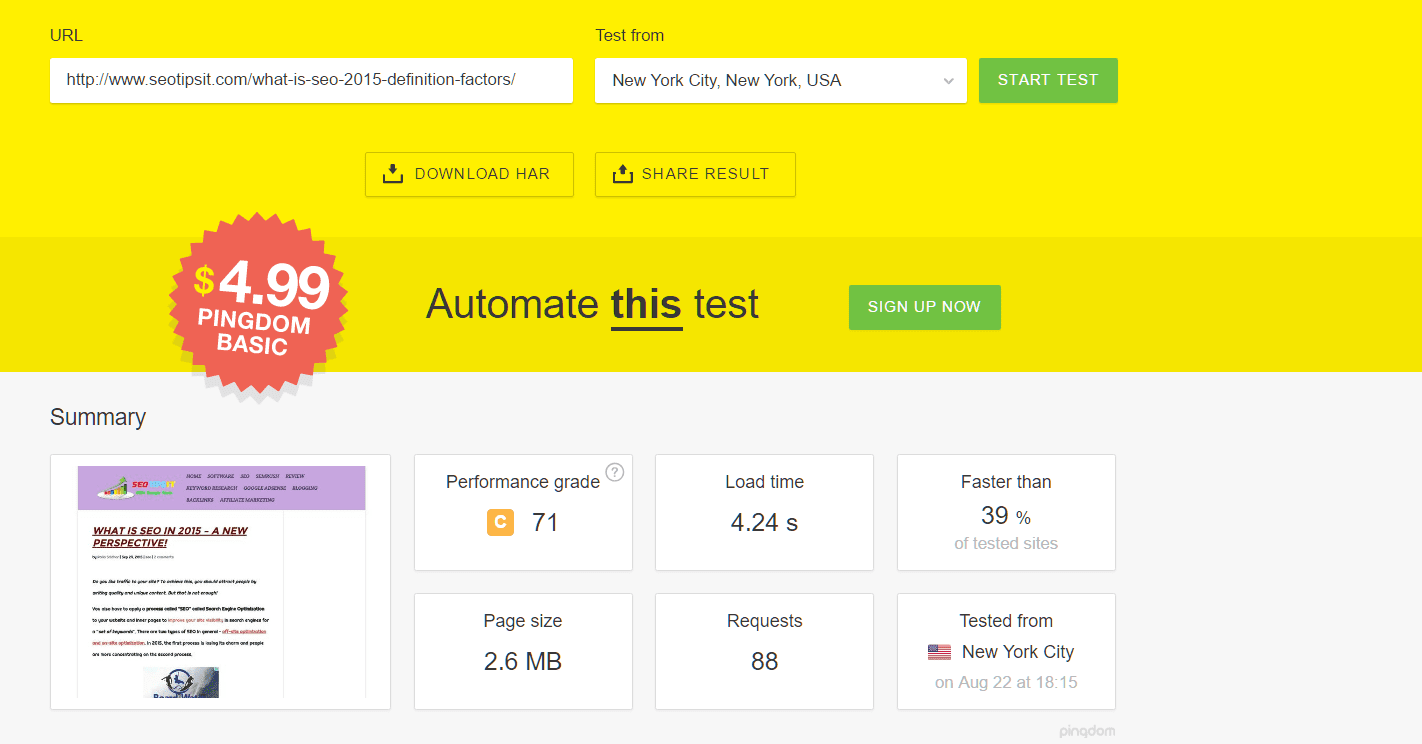
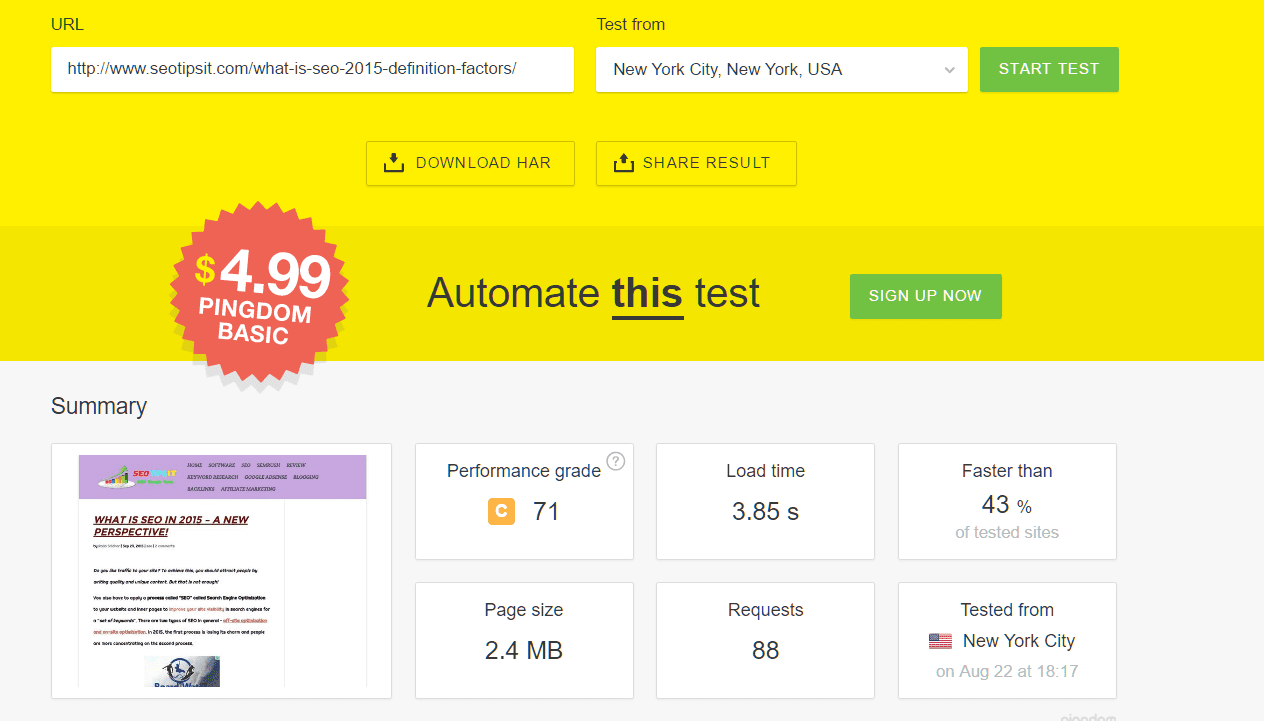
Here, you can observe the general trend for this particular test web page. The page size is approximately 2.5 MB. The number of requests are around 75 to 85.
The next web page speed checking tool I used was GTmetrix. Here, the test server is located in Canada. So you will get different page load times compared to the US server locations. As you can see, the average page load time is around 3.8 secs, which is much higher than that of Dallas, Texas, USA.
|
Vancouver, Canada |
||
|
Total Page Size |
Page Load Time |
Requests |
|
2.25mb |
3.6s |
66 |
|
2.30mb |
3.6s |
70 |
|
2.20mb |
4.0s |
68 |
Second Phase – Inmotion Hosting VPS + W3TC plugin.
In this second phase, I installed and activated the W3TC plugin. This is an advanced cache plugin with several options. It provides, browser cache, minification of JS, CSS files etc. I tested the same earlier test page, from the same server locations.
|
New York City, New York, USA |
|||
|
Page Size |
Load Time |
Requests |
Faster than of tested websites |
|
1.5mb |
2.43s |
74 |
64% |
|
1.7mb |
2.64s |
91 |
60% |
|
1.8mb |
4.34s |
91 |
38% |
|
1.7mb |
2.82s |
91 |
57% |
|
Dallas, Texas, USA |
|||
|
Page Size |
Load Time |
Requests |
Faster than of tested websites |
|
1.6mb |
1.47s |
82 |
82% |
|
1.6mb |
1.42s |
82 |
82% |
|
1.6mb |
2.28s |
82 |
67% |
|
1.5mb |
1.33s |
67 |
84% |
|
Melbourne, Australia |
|||
|
Page Size |
Load Time |
Requests |
Faster than of tested websites |
|
1.5mb |
4.04s |
77 |
41% |
|
1.7mb |
6.68s |
89 |
23% |
|
1.5mb |
4.07s |
77 |
41% |
|
1.5mb |
4.75s |
77 |
35% |
As you can see, you can observe some interesting facts from these pingdom tests. The page size has reduced from 2.5 MB to around 1.6 MB on an average. This is because of caching mechanism of the plugin, where it caches static files and cookies. Also, the main advantage you can observe is in the improvement of web page load time. It has drastically decreased from around 3 secs to 1.5 secs for Dallas, Texas, USA.
So this is an improvement of over 50% in the page load speed, which can definitely improve your rankings in Google. From my own experience, I duly suggest that you using this plugin with correct configuration can definitely improve your page load time and concurrently the website traffic also.
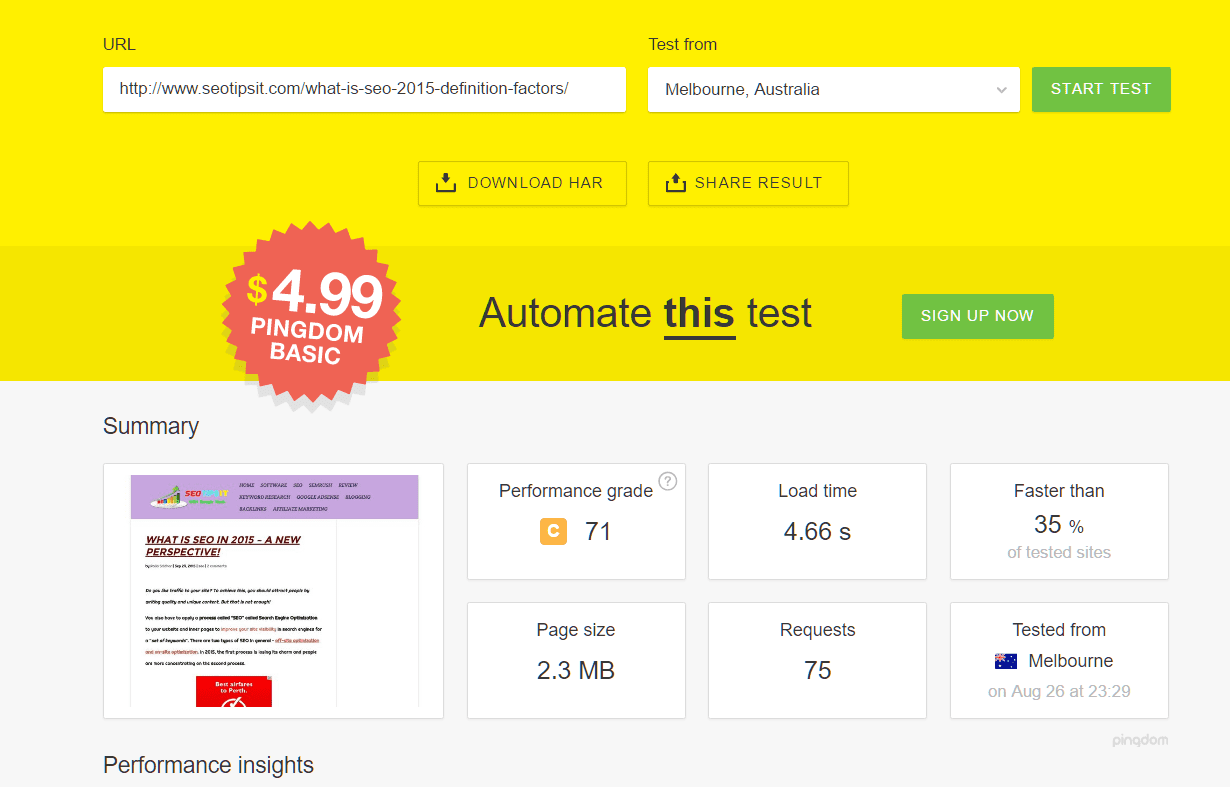
I also tested the same article, using GTmetrix. In this test result, I observed that there is a decrease in total page size of 35%. But the page load times showed some confusing results. Though I tested the page 4 times, I got 4 different timings with each test. May be doing some more tests with different web pages, can give more understanding of the results with this tool.
|
Vancouver, Canada |
||
|
Total Page Size |
Page Load Time |
Requests |
|
1.40mb |
4.8 |
68 |
|
1.41mb |
3.2 |
68 |
|
1.50mb |
2.2 |
68 |
|
1.47mb |
4.3 |
65 |
Third Phase – Inmotion VPS Hosting + W3TC plugin + Cloudflare
In this phase, I used a free CDN tool called Cloudfare alongwith W3TC to get double benefit. It provides some free services, though if you want more additional benefit from this service, you need to buy their Pro and Enterprise plans. Initially, I emptied the cache of W3TC.
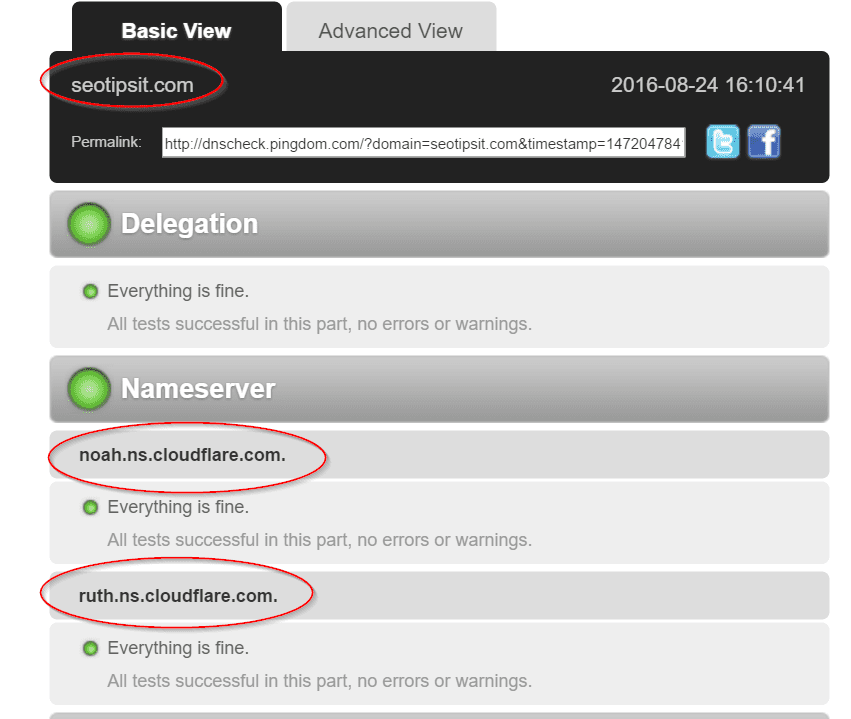
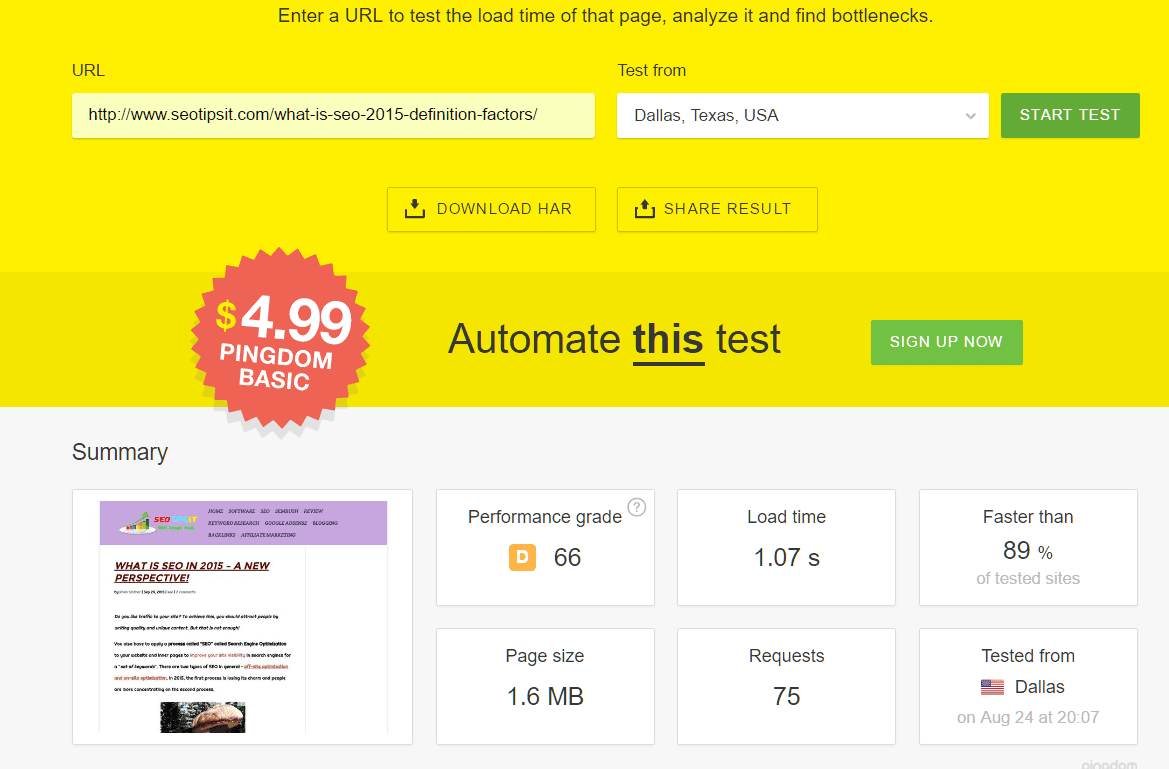
In this test with pingdom, I did not see any drastic reduction of page size when compared to only W3TC test. But regarding load times, I observed that there is around 1 sec reduction of page load time, for NewYork server. But when compared with the Texas server, there was not much decrease in page load time.
|
New York City, New York, USA |
|||
|
Page Size |
Load Time |
Requests |
Faster than of tested websites |
|
1.6mb |
5.1s |
74 |
32% |
|
1.6mb |
1.43s |
74 |
82% |
|
1.5mb |
1.47s |
69 |
82% |
|
1.6mb |
1.13s |
74 |
88% |
|
Dallas, Texas, USA |
|||
|
Page Size |
Load Time |
Requests |
Faster than of tested websites |
|
1.6mb |
1.29s |
75 |
85% |
|
1.6mb |
1.40s |
77 |
83% |
|
1.5mb |
2.22s |
82 |
68% |
|
1.6mb |
1.07s |
75 |
89% |
|
Melbourne, Australia |
|||
|
Page Size |
Load Time |
Requests |
Faster than of tested websites |
|
1.5mb |
5.45s |
74 |
30% |
|
1,6mb |
2.83s |
75 |
57% |
|
1.6mb |
3.42s |
77 |
48% |
|
1.5mb |
1.98s |
74 |
72% |
Another interesting point to note from the above two phases is that, if your pingdom server is located close to your hosting server, your website is much faster to load. As you can see the Dallas results from both the phases, I get a good result of my website saying that it is “ 85% faster than other tested websites”.
When I tested with GTmetrix server, there is a slight improvement in load time of the web page compared to using W3TC plugin only. There is also no decrease or increase in the total page size. Here also, the page load times, were not the same, even after repeating the load test 3 times.
|
Vancouver, Canada |
||
|
Total Page Size |
Page Load Time |
Requests |
|
1.49mb |
2.5s |
73 |
|
1.46mb |
3.8s |
69 |
|
1.49mb |
2.9s |
74 |
Two Different Test Pages from the same Website – Average Load Times
Just to get a more definitive conclusion, I tested two another web pages from the same web site. The average results from different test server locations are as follows.
|
Tested from |
Page Size |
Load Time |
Requests |
Faster than of tested websites |
|
melbourne |
2.3mb |
6.57s |
215 |
24% |
|
dallas |
2.3mb |
2.39s |
215 |
64% |
|
new york |
2.5mb |
2.54s |
224 |
62% |
|
stockholm |
2.2mb |
3.29s |
212 |
50% |
|
Vancouver, Canada |
||
|
Total Page Size |
Page Load Time |
Requests |
|
2.08mb |
6.5s |
184 |
The page size for the first web page was around 2.4 MB. Here, also the load time was much less for the Dallas server. As usual, the Melbourne, Australia server took more than 6 secs to load the test page completely. I also tested another server location of Stockholm, Sweden. This test server is located in Europe.
So as expected the page load time was little more compared to the US server locations.
For the second page, I chose a test page which is lesser in page size, images and requests. The page size on an average was around 800 KB. The number of requests were around 68 to 69. As expected, since the page size was smaller compared to the earlier two pages, the load time was also fast.
The page load time was around 1 to 1.5 secs for different server locations. California server was the fastest with page load time of 929ms. Also, the page was faster than 85 to 91% of the tested web sites.
|
Tested from |
Page Size |
Load Time |
Requests |
Faster than of tested websites |
|
melbourne |
756KB |
1.56s |
68 |
80% |
|
dallas |
800KB |
1.04s |
69 |
89% |
|
california |
804KB |
929ms |
68 |
91% |
|
stockholm |
791KB |
1.12s |
69 |
88% |
Conclusion
So from the above experiments and case-study we can conclude the following points.
1. Using a VPS server, does give better load times. Though this point could not be validated in this case-study, but by comparing with a shared server, we can get a more conclusive evidence of this point.
2. The major result, that we can conclude is that, using the W3TC plugin drastically improves your page loading time. You can see that there is a decrease of 50% of load time in most of the cases. Also from my personal observation, I observed this has direct impact on your organic or Google traffic.
3. If your hosting server is located in United States, then you have better chances to rank well in search engines. This is not just the case with USA, but whatever search engine TLD, you are trying to rank for, it is in best interest to put your website files on a server that is located in that country.
4. Another major observation is that, Pingdom and GTmetrix test results vary even after conducting 3 to 4 iterations. This is because of the way each one operates. So if you want a more accurate values of your load times, it is better to test with 3 to 4 speed test tools and then come to a conclusion.
5. The best conclusion we can get is that, using all the 3 methods in combination (VPS+W3TC+Cloudflare) will get you the least page load times. This also depends on the type of hosting service you use.
6. Also, if your visitors are from a far-off location from the hosting server, it is better to use the combination of VPS+W3TC+Cloudflare. This can be seen from the results of Melbourne server.
We can also check the load time results by using another CDN like MaxCDN, to see if there any better plus points of improving website loading speed.
Please bookmark this website and in another case-study, I am going to detail about the use of SiteGround with MaxCDN and how they improve the website loading times.

